
When I launched my first wordpress-blog/" rel="nofollow noopener noreferrer">WordPress blog, I treated analytics like a magic 8-ball — I asked it questions, shook it a lot, and mostly got vague answers. That changed when I started treating analytics plugins as decision tools instead of vanity meters. The difference? I stopped guessing and started making measurable changes that grew my audience and wallet, not just my ego. ⏱️ 9-min read
This guide walks you through choosing and configuring beginner-friendly WordPress analytics, defining measurable goals, validating data, reading behavior signals, building a content calendar driven by real opportunities, running small experiments, and turning clicks into revenue — all with free or low-cost plugins and a little elbow grease. Expect practical steps, honest examples from my own blog experiments, and a few sarcastic metaphors to keep you awake.
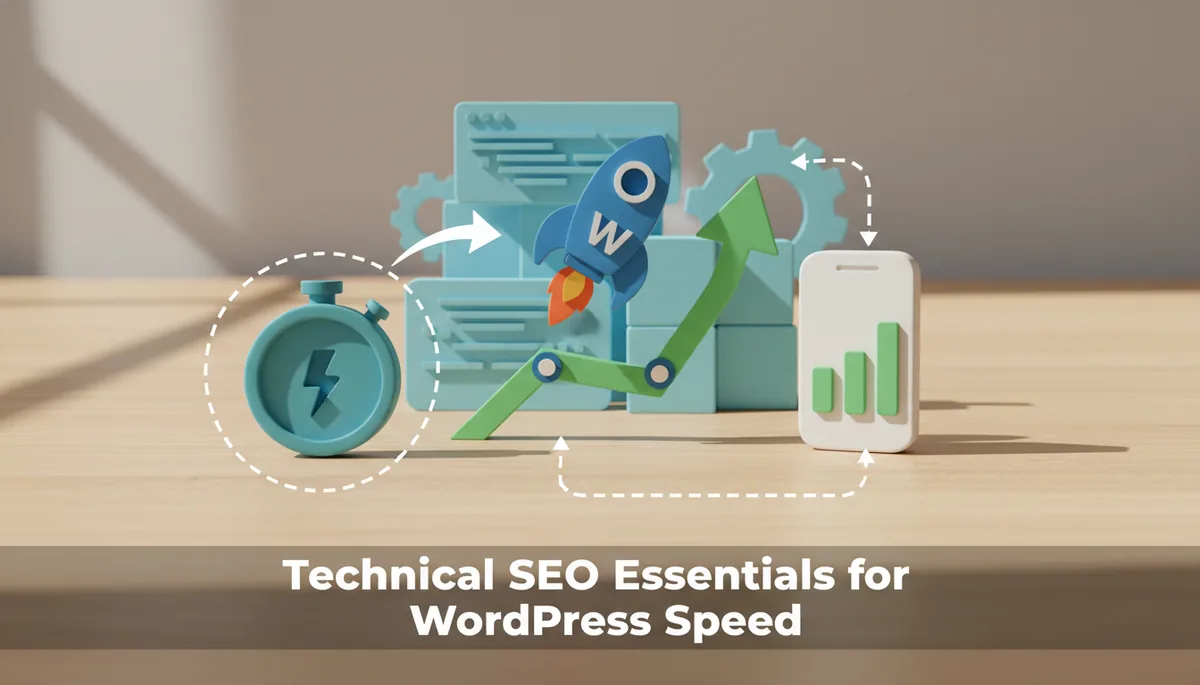
Choosing and configuring beginner-friendly WordPress analytics plugins
Picking an analytics plugin is like choosing a bicycle: you want something that fits, won’t collapse on the first hill, and has working brakes. For WordPress beginners, the main choices are:
- Google Site Kit — the official Google integration that brings GA4, Search Console, and AdSense into WordPress. Powerful, but the UI can feel like a spreadsheet impersonating a Rubik’s Cube.
- MonsterInsights (Lite) — simplifies GA4 data into friendly language inside your dashboard; great for people who want insights without a PhD in analytics.
- Analytify Free / Jetpack Analytics — straightforward dashboards for key stats if you prefer fewer bells and whistles.
- Plausible or Matomo — privacy-first alternatives (cookieless or self-hosted), for those who prefer avoiding consent gymnastics or want tighter control of data.
I recommend starting with Site Kit or MonsterInsights Lite because they make the vital connection to Google Analytics 4 (GA4) and Search Console painless. Install, follow the authorization prompts, and then immediately open GA4’s Real-Time report to confirm traffic is visible. If your test page view doesn’t appear in seconds, something’s miswired — and yes, I’ve spent an hour blaming the plugin when it was an API permission I forgot to grant. Classic.
When configuring, focus on two things: making goals visible and avoiding duplicate tags. If you use Site Kit to connect GA4 but also have a theme or header script that injects a GA4 tag, you’ll double-count. Check the page source for multiple gtag or GTM snippets. Finally, enable any plugin-built event auto-tracking (outbound link clicks, downloads, form submissions) if it maps to your goals — but only after you verify Fire in DebugView. For official GA4 setup details, check Google’s docs: GA4 documentation.
Defining measurable goals that reflect real growth
“More traffic” is not a goal; it’s a mood. Real growth goals are specific actions that move your blog toward an outcome: subscribers, affiliate affiliate clicks, resource downloads, or purchases. When I switched from vague goals to three trackable conversions — newsletter signups, top-article scroll-to-CTA clicks, and affiliate clicks — I could finally say which content actually paid the bills and which was just window dressing.
Start by listing three priority conversions that matter to your business model. Examples that work well for beginner WordPress blogs:
- Email signups (newsletter form submitted)
- Affiliate link clicks (outbound click leading to partner site)
- Content engagement (long scroll depth or video play indicating strong interest)
Next, give each one a clear, trackable name in your analytics: sign_up_form_submit, affiliate_outbound_click, article_scroll_75. Use event names that are human-readable — future you will thank past you when hunting through reports. In GA4 you can mark these events as conversions so they appear in conversion reports and funnels.
Design funnels that mirror the real user journey. For a newsletter signup: land on post → read to CTA → click CTA → submit form. Funnels let your dashboard answer the key question: “What moved the needle and why?” If 10,000 people read an article but only 10 sign up, the funnel will show where you lose them. Concrete goals let you A/B test specific changes rather than hypothesize like a fortune teller hoping for inspiration.
Ensuring data accuracy: clean setup and validation
Bad data is the digital equivalent of following a GPS that cheerfully reroutes you into a lake. If you don’t trust your numbers, you’ll optimize toward illusions. Here’s how to keep your analytics honest.
- Verify tracking in real time: Use GA4’s DebugView (or your plugin’s debug mode) to create events as you click and confirm they appear. For example, open a new post, click your CTA, submit the newsletter form, and watch DebugView register sign_up_form_submit immediately.
- Remove internal traffic: Exclude your own IPs, logged-in admin visits, and staging environments. GA4 supports internal traffic definitions; plugins often offer filters for user roles. If your team is clicking around, those sessions will otherwise inflate metrics and mislead you.
- Avoid duplicate tags: Inspect page source for multiple gtag.js or analytics.js snippets. Two tags = two counts. Consolidate to one insertion method (preferably Site Kit or a single GTM container).
Also, validate cross-platform consistency. Check that the plugin dashboard, GA4, and Search Console roughly align for sessions and top pages. They won’t be identical (sampling, filters, and sessionization differ), but large gaps are a red flag. I once had a 40% mismatch because a client’s caching plugin served a stripped-down header on some pages — fun until we noticed we were “popular” only in cached land. Finally, document a quick validation checklist and run it after major theme or plugin updates so a rogue update doesn’t derail months of clean data.
Tracking user behavior and engagement metrics
Analytics is less about how many people came and more about what they actually did while they were there. Engagement metrics separate casual passersby from real fans. Think of sessions as window shoppers and engaged sessions as people who actually pick something up and read the label.
Key engagement metrics to track:
- Engaged sessions and engagement rate — GA4’s way of telling you who stuck around and didn’t immediately bounce.
- Average time on page and scroll depth — how deeply readers consume a post; scroll depth of 75%+ is a good proxy for full reads on long-form posts.
- Return rate — shows if readers come back, a sign of sticky content or a growing fan base.
Events matter because they map behaviors to outcomes. Track outbound clicks, file downloads, video plays, and form submissions. Use heatmaps or session recordings sparingly to validate qualitative hypotheses. Tools like Hotjar (free tiers exist) can show whether your CTA sits below the fold where nobody sees it, or whether people hover over the “buy” button but don’t click because the price isn’t visible.
Concrete example: On one of my how-to posts, scroll depth showed 65% of readers dropped off right before the opt-in CTA. A quick move — placing the CTA earlier and adding a “save for later” bookmark — increased engaged sessions by 18% and signups by 12% in one month. Your plugin’s event builder or GA4’s event configuration should make this kind of tracking straightforward; don’t be afraid to instrument multiple events on high-value pages.
Finding your fastest paths: identifying top content and traffic signals
Think of your blog as a map of fast-travel nodes. Some pages will be tiny gold mines of attention and conversions, others will be charming but empty cottages. Your job is to find the gold mines and replicate what makes them work.
Start with landing pages: sort by sessions and conversion rate. Pages with both high traffic and strong conversion rates are your MVPs. Treat these like VIPs — update them, add internal links, and consider turning them into pillar content that supports related posts. Low-traffic but high-conversion pages are hidden gems: they may need better promotion or internal linking to scale.
Next, examine acquisition sources. Is organic search delivering steady traffic while social spikes are episodic? Use Google Search Console to check queries and impressions (linking your Search Console with Site Kit makes this effortless). If a handful of long-tail keywords consistently send engaged visitors, create a content cluster around those topics. A page ranking for “best budget standing desks under $200” can anchor several buying guides and reviews that feed affiliate revenue.
Check referral sites and social posts. An unexpected referral from a niche forum can spike high-quality traffic who read deeply and convert. When that happens, study the referring context — was it a single helpful link or a featured mention? Replicate the approach: guest post, reach out to the referrer, or create similar content that appeals to that community. Cross-checking Search Console, GA4 landing-page reports, and your plugin dashboard will reveal which signals to chase.
Planning a data-driven content calendar
Random posting is like throwing darts with a blindfold and hoping for a bullseye. A content calendar anchored to analytics helps you aim where the audience already wants to be. I plan topics around three inputs: audience questions, top-performing pages, and Search Console keyword opportunities.
Steps to build a calendar that moves metrics:
- Audit top pages and list related subtopics: If “guide to backyard composting” drives traffic, create “composting mistakes” and “composting for small patios” to capture adjacent intent.
- Pull Search Console queries for the site and filter for pages with impressions but low clicks — these are low-hanging opportunities where better titles or meta descriptions could lift traffic.
- Schedule cadence and targets: decide how often you can realistically publish (e.g., one long-form post + one shorter update per week) and set measurable monthly targets (e.g., +15% engaged sessions on pillar pages).
Tie each calendar item to a KPI and a promotion plan. Don’t just publish and pray — assign UTM-tagged distribution (newsletter, Twitter, Facebook groups, specific communities), and schedule follow-ups: update the pillar post after six weeks with internal links to the new content, and re-promote on social channels where similar posts performed well. Use your plugin’s dashboard to monitor initial traction; if a post that should perform well flops, use the next week’s calendar slot to A/B test the headline and meta description.
Running lightweight, data-backed experiments
Experiments don’t have to be complex statistical behemoths. Start with microtests that isolate one variable and give you clear directional data. Think of it as kitchen-sink science: one ingredient change at a time, not a five-course molecular gastronomy extravaganza.
Example experiments you can run with minimal tooling:
- Headline test: Swap your headline for a week and measure click-through and time on page. Use GA4 event for “article_opened” from social or Search Console CTR to compare.
- CTA placement: Move the signup form above the fold on one high-traffic page and compare signups vs the control over two weeks.
- Format comparison: Create one how-to and one case-study on the same topic, promote both the same way, and compare engaged sessions and conversions.
Keep experiments simple and document them. For each test, record the hypothesis, variant, primary metric, sample size target, and testing window. Require a minimum sample before deciding — don’t declare victory after a fluke spike from a random tweet. I once called a headline change “proven” after three days and my analytics smacked me with a social-share-driven outlier; lesson learned, humility paid for by a few