
I’ve built and edited enough small blogs to know the feeling: you publish a post, pray to the SEO gods, and check traffic every five minutes like it’s a newborn baby. That approach is adorable—until you want predictable growth. This guide shows how to stop guessing and start using WordPress plugins to translate analytics into concrete content decisions that actually move the needle. ⏱️ 12-min read
We’ll walk through a practical setup (GA4 + WordPress plugins), pick the right metrics, build a repeatable content plan, find topics that will rank and convert, run smart on-page tests, automate publishing and distribution, and give you ready-to-use templates and quick plays. Expect actionable steps, real examples from my work, and the occasional sarcastic quip—because SEO shouldn’t read like a dry textbook at a funeral.
Set up a reliable analytics foundation with WordPress plugins
Reliable numbers start with a clean plumbing job. I always begin with one of two setups: Google Site Kit for a free, tight integration, or MonsterInsights/Analytify for a more dashboard-friendly, feature-rich approach. Site Kit connects Search Console and Analytics directly and is perfect if you like Google’s ecosystem and don’t want extra plugins. MonsterInsights plugs GA4 into WordPress with less fuss and gives you easy toggles for enhanced measurement events like outbound clicks, downloads, and form submissions. If you prefer a lightweight visual view of traffic without diving into GA4's maze, Analytify is another solid choice.
Practical steps: install the plugin, create or choose your GA4 property, and paste the Measurement ID (or authenticate via Google). Enable enhanced measurement so pageviews, scrolls, site searches, and outbound events are captured automatically. Turn on event tracking for downloads, contact forms, and CTA clicks—these are the raw materials of conversion analysis. Pro tip: exclude admin users from tracking so your lunchtime refreshes don’t corrupt the data.
Privacy is non-negotiable these days. Pick plugins that offer GDPR/CCPA features: consent banners, IP anonymization, and the ability to disable tracking for users who opt out. MonsterInsights and Site Kit provide these controls, and you should also configure data retention to avoid holding personally identifiable data longer than necessary. Think of privacy settings like deodorant: you don’t want to skip it, especially not on long-term projects.
Finally, validate that data is flowing. Use the plugin’s dashboard to confirm pageviews and events, then cross-check a few pages in GA4’s Realtime or DebugView. If numbers match within reason, you’ve got a foundation. If not, go hunting—common culprits are multiple tags, mis-configured filters, or staging sites leaking into production metrics.
Define your North Star metrics and KPI dashboards
Metrics are like spices: too many and your report tastes weird. Pick 3–5 North Star metrics that reflect the real value of your content rather than just popularity. In my projects I typically keep sessions (or organic sessions), engaged time per session, scroll depth (or percentage of page scrolled), and content-driven conversion rate as the core set. These tell you whether people found, read, and did something valuable—not just that they arrived and ghosted.
Distinguish vanity from actionable KPIs. Pageviews are fine for ego boosts; engagement rate and conversion rate tell you whether readers are sticking around and taking next steps. Set concrete targets you can measure: for example, aim for average time on page > 120 seconds, mobile scroll depth above 60%, and content-driven conversion rate > 2% for lead magnets. These numbers aren’t magical—they’re practical guardrails that let you prioritize optimization work.
Build dashboards that are actually useful. Use GA4 explorations to create a compact “content health” report (landing page, sessions, average engagement time, scroll depth, conversions, and conversion rate). If you use MonsterInsights or Analytify, customize the plugin dashboard to show those same fields so you can scan in 60 seconds. Schedule a weekly review—my team skims the dashboard every Monday and saves a short list of pages to either update, repromote, or A/B test.
Use segments. Compare organic traffic to social and email, and break out mobile vs desktop. A page might have great desktop engagement but mobile users bail at 15 seconds—different fixes there. If your dashboard starts to look like a late-night grocery receipt, simplify: remove any metric that doesn’t link to a decision you’ll take in the next 30 days.
Create a data-driven content plan template
A content calendar that’s not tied to data is just a pretty art project. My template connects each post to an expected outcome, the KPIs I’ll watch, and which keyword cluster it serves. For each entry include: title/topic, publish date, target audience/persona, buyer-journey stage (awareness, consideration, decision), primary metric (e.g., organic sessions), secondary metric (e.g., conversion rate), and proposed CTA. I also add a "why this post" field with supporting analytics (past post that inspired it, Search Console query volume, or internal search terms).
Here’s how it looks in practice: say you spot a high-impression Search Console query—“best WordPress image optimization plugins” with lots of impressions but low clicks. You create a pillar post (comprehensive guide), schedule two follow-up short posts comparing top plugins (topic cluster), and map each to the buyer journey: guide for awareness, comparison for consideration, and a short checklist targeting decision-stage readers (with an invite to download your optimization checklist). Assign one primary KPI to each piece: organic clicks for the pillar, engaged time for the comparison, and conversion rate for the checklist.
Use historical winners to inform format and cadence. Pull the top 10 posts from the last 6 months and note patterns: are listicles outperforming how-tos? Do case studies convert better? Use that pattern to distribute 60% proven formats and 40% experiments. Tag posts with content pillars and use UTM parameters on your promotional links so the plugin can attribute traffic and conversions back to the campaign.
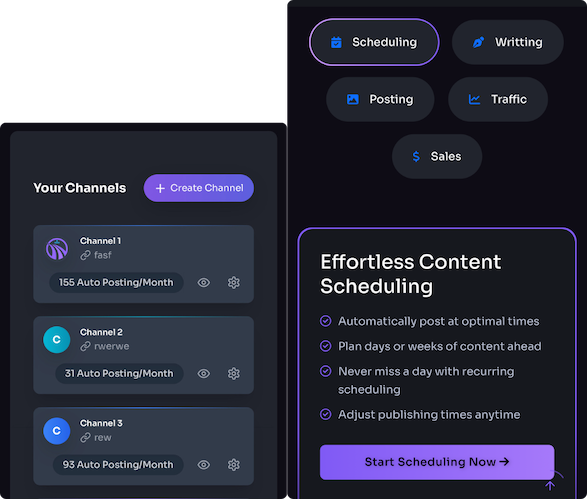
Automate parts of the plan. If you use a platform like Trafficontent, SEO prompts and metadata can be auto-populated, and distribution can be scheduled with UTMs attached. But always include manual checks: AI drafts are great for speed, not for brand nuance or authority. Think of your template as a living thing—review and tighten it each month based on the KPI outcomes you track in your dashboard.
Identify high-potential topics with plugin insights
Good topic selection is 70% detective work, 30% common sense, and 100% less stressful than shouting into the void. Start by analyzing your top-performing landing pages and the queries driving impressions. With Search Console integrated into WordPress via Site Kit or with metrics surfaced by plugins, you can quickly pull top queries, impressions, clicks, and landing pages. Those signals tell you what readers are already asking—so answer better, faster, or with more depth.
Don’t ignore your internal search analytics. Your site search is often a neglected goldmine. If people are frequently searching for "email subject lines" on your site but only find a short blurb, that’s demand crying out for a proper guide. Configure internal search tracking (both in GA4 and your plugin) and treat frequently-searched terms as high-priority topics. Fixing these gaps often yields quick wins because intent is already proven.
Validate with SEO tools (Ahrefs, SEMrush, Moz). Don’t just follow intuition—check keyword difficulty and potential traffic. A practical rule I use: prioritize topics where your domain has at least a reasonable chance to rank (low-to-medium difficulty) and where the top-ranking pages are thin or outdated. Estimate expected monthly clicks by using position-based CTR curves (for example, the top position often captures ~30% of clicks). If the math says you can get meaningful traffic and the topic aligns with your conversion goals, move it up the queue.
Automate the shortlist. Many plugins and platforms let you export query and landing page data to CSV—use that to build a scoring model (impressions x relevance / keyword difficulty). I once turned a three-hour manual audit into a 30-minute weekly sprint by automating the data pull and applying a simple score. It felt a bit like cheating, but the results—more consistent topic choices and fewer ego-driven experiments—were delightfully tangible.
On-page optimization and testing powered by analytics
A post that gets clicks but no engagement is like a flashy party guest who leaves without saying goodbye—mysterious and disappointing. Use analytics to spotlight pages that need work: high exit rates, low average engagement time, or drop-offs at critical scroll markers. Start with quick wins: tighten the intro, add a clear above-the-fold CTA, break up long text with subheads and bullet lists, and add a table of contents for long posts. These fixes are low effort and often move the needle immediately.
Then move to A/B testing. Google Optimize was a handy free tool, but it’s been sunset, so for WordPress I recommend plugin-based split-testing like Nelio A/B Testing, Thrive Optimize, or Split Hero which integrate well with WP and hook into GA4 for tracking. Always test one variable at a time—headline, CTA copy, CTA color/placement, or layout. Run tests until you reach statistical significance—aim for 95% confidence—and make sure sample size is large enough; there's no point declaring victory after 23 visitors with strong opinions.
Use engagement metrics (scroll depth, engaged time) as test outcomes in addition to clicks. For example, if headline variant B increases scroll depth past 50% and engaged time by 30%, that’s meaningful even if the click-through on the CTA is unchanged—because better engagement usually precedes improved conversions. Also, sharpen internal linking based on user flow data: if analytics shows readers are interested in a subtopic, add contextual links to relevant posts or a recommended reading box near the natural break.
Finally, measure the lift and scale it. When a CTA variant wins, roll it across similar templates or category pages, then re-run a smaller test to confirm it translates. This process turns small wins into compound growth—like figuring out a good espresso shot and then making the entire café more profitable.
Automate data-to-publish workflows and distribution
Automation is not a magic wand but a time-turner. Use Editorial Calendar, Auto Post Scheduler, or PublishPress to automate scheduling around your analytics signals. For instance, when a post hits a traffic or engagement threshold (say, 25% above baseline in the first week), configure an automation to re-share it on high-impact channels during peak hours. That’s smarter than a random tweet at 3 a.m.—unless your audience are vampires, in which case carry on.
If you’re using an AI-assisted platform like Trafficontent, you can auto-generate SEO-optimized drafts, schedule publishing, and push promotional assets to Pinterest, X, and LinkedIn with UTMs attached. That ensures promotional traffic is attributed properly in your analytics, so you can tell whether social pushes actually drove conversions or just inflated your ego. Also make Open Graph data and thumbnails part of the automation—good images and titles dramatically affect social CTR.
Tie analytics to distribution decisions. When a post spikes in engagement, don’t just pat yourself on the back—resurface it with a targeted social push, an email teaser, or a new internal link from a relevant pillar page. Set rules: for example, if organic sessions > 200% of median for two days, schedule a second promotional push during your next peak hour. Use UTMs to track each promotion variant, so you can see whether LinkedIn posts or Pinterest pins consistently drive better conversions.
Automate repurposing too. Convert long posts into short social threads, create image quotes for Instagram, or generate an email digest for your newsletter. The goal is to turn one insight into multiple touchpoints without manual busywork. You’ll sleep better knowing your content garden is watering itself—most of the time.
Case-ready templates and quick-win playbooks
Templates are where strategy meets execution. I give clients three core templates: a content-calendar row template, an SEO checklist, and a post-creation KPI checklist. The calendar row includes the title, keyword cluster, buyer stage, primary KPI, secondary KPI, publish date, author, and promo UTMs. The SEO checklist is quick: target keyword, intent match, title and meta, H1/H2 structure, image alt text, internal links, and canonical tag. The KPI checklist is the safety net: baseline metrics, target lift, test plan, and a 30-day follow-up date.
Quick-play examples: a “Refresh and Relaunch” play—identify underperforming pages with high impressions but low CTR, rewrite title/meta, compress images for faster load, add a prominent CTA, and repromote via a scheduled social push with UTM tags. Another is the “Internal Search Fix”—pull top internal search terms, create or expand content for the top three gaps, and add navigation or a FAQ module to catch those users earlier.
Include ready-to-copy email templates for promotion: a teaser for subscribers, a deeper dive for your most engaged segment, and a social thread that teases functional takeaways. Each template should include UTM parameters pre-filled so the plugin can surface performance in your dashboard without extra spreadsheet drama. I’ve seen teams spend more time tagging links than writing—don’t be that team.
Finally, keep a playbook for A/B tests: hypothesis, variant, sample size target, tracking events, and follow-up actions. That way you don’t end tests with hugs and vague feelings; you finish with a documented decision and a scaling plan. Copy these templates into Notion, Google Sheets, or your editorial tool, and reuse them until they wear out. Templates are boring until they save you from panic and poor judgment—and then they're heroic.
Real-world examples: small blogs that scaled with plugins and process
I’ve seen a tiny niche blog double organic traffic in six weeks by turning analytics into decisions rather than superstition. The site owner used Site Kit to pull Search Console queries into WordPress and found a cluster of high-impression keywords around “plugin X vs plugin Y.” They consolidated several thin posts into a single in-depth comparison, rewrote titles and meta descriptions to match query intent, and added internal links from related how-tos. Within six weeks, sessions rose 50% and engagement metrics improved—because they answered a clear user need instead of guessing at what sounded clever.
Another example: a small e-commerce blog ran successive CTA A/B tests with a WordPress split-testing plugin tied to GA4. They tested placement, color, and copy on product-top posts. A bold